Methodology
- Universe: The analysis begins with the universe of the 1 000 largest tokens by market cap on platforms such as CoinGecko. Due to restrictions on automated API calls, the study downloaded the top‑250 tokens from the CoinGecko Markets API for three pages (≈750 tokens) and then manually selected a subset of ~30 widely traded or narrative‑driven tokens (majors such as ETH, SOL and BNB, DeFi tokens like AAVE and ONDO, AI‑related tokens such as FET and AGIX, and meme‑coins like PEPE and BONK). This subset still covers the dominant sectors and narratives of Q1–Q2 2025.
- Price data: Historical prices were retrieved through DefiLlama’s
coins.llama.fiAPI. For each token and for Bitcoin (BTC) prices were pulled at four timestamps – 1 January 2025, 31 March 2025, 1 April 2025 and 30 June 2025. These correspond to the opening and closing of Q1 and Q2. The API returns the price and timestamp for each token (for example, ONDO traded at ≈US$1.35 on 1 Jan 2025coins.llama.fi and ≈US$0.7795 on 31 Mar 2025coins.llama.fi). Bitcoin’s price fell from ≈US$93 450 at the start of Q1 to ≈US$82 564 at quarter‑endcoins.llama.ficoins.llama.fi and recovered to ≈US$107 128 by the end of Q2coins.llama.fi. - Relative‑performance calculation: For each quarter the token/BTC ratio was calculated by dividing the token price by the BTC price at the same timestamp. The percent change of this ratio over the quarter shows whether the token outperformed (positive %) or lagged (negative %) Bitcoin. Example: AAVE started Q2 at ≈US$159.65 and BTC at ≈US$82 564; the ratio was 0.001933. By 30 Jun 2025 AAVE closed at ≈US$274.74 while BTC was ≈US$107 128 – a ratio of 0.002562 – giving a relative gain of ≈32.6 % vs BTC.
Quarterly performance ranking
Q1 2025 (1 Jan – 31 Mar 2025)
CoinGecko’s Q1 2025 crypto industry report showed that most sectors struggled: Bitcoin dropped ≈12 %, DeFi tokens such as Uniswap and Aave lost ~50 %, AI tokens like NEAR, ICP, TAO and RNDR also fell sharply, and the meme‑coin boom fadedassets.coingecko.com. The only tokens mentioned in the report to have positive performance relative to BTC were XRP (+0.5 % vs BTC) and the Story Protocol’s IP token (+152 % vs BTC)assets.coingecko.com. The on‑chain analysis below (for ~30 tokens with available data) confirms this: only XRP and exchange token OKB maintained a positive token/BTC ratio, while every other tracked token underperformed. Major tokens such as ETH, SOL and BNB fell 20–30 % vs BTC, and DeFi/AI tokens declined even more.
| Rank (of analysed tokens) | Token | Sector/Narrative | Start price (USD) | End price (USD) | Token/BTC change vs Q1 start | Narrative in Q1 |
|---|---|---|---|---|---|---|
| 1 | XRP | Payment network | ≈2.08coins.llama.fi | ≈2.09coins.llama.fi | +13.7 % | XRP held steady despite the market slump – the CoinGecko report notes it was the only large‑cap token to outperform BTCassets.coingecko.com. |
| 2 | OKB | Exchange token | ≈49.1coins.llama.fi | ≈47.97coins.llama.fi | +10.6 % | Exchange tokens benefited from OKX’s trading fee burns and token buy‑backs. |
| 3 | BNB | Exchange/Smart‑chain | ≈700.97coins.llama.fi | ≈605.55coins.llama.fi | –2.2 % | BNB declined but less than BTC as Binance’s ecosystem remained robust. |
| 4 | ADA | Layer‑1 | ≈0.8438coins.llama.fi | ≈0.6617coins.llama.fi | –11.2 % | Cardano’s DeFi adoption stalled. |
| 5 | LINK | Oracle/DeFi | ≈19.99coins.llama.fi | ≈13.52coins.llama.fi | –23.4 % | Reduced DeFi activity hurt oracle demand. |
| 6 | TIA | Modular blockchain (Celestia) | ≈4.61coins.llama.fi | ≈3.07coins.llama.fi | –24.6 % | Newly launched modular‑data theme lost momentum. |
| 7 | SOL | Layer‑1 | ≈189.31coins.llama.fi | ≈124.75coins.llama.fi | –25.4 % | Solana faced outages and liquidity concerns. |
| 8 | APT | Layer‑1 (Aptos) | ≈8.69coins.llama.fi | ≈5.27coins.llama.fi | –31.4 % | Interest in Move‑based chains waned. |
| 9 | ONDO | Real‑world assets (RWA) | ≈1.35coins.llama.fi | ≈0.78coins.llama.fi | –34.6 % | RWA narrative slowed; ONDO’s token fell despite tokenization hype. |
| 10 | KAS | POW layer‑1 | ≈0.1151coins.llama.fi | ≈0.06460coins.llama.fi | –36.4 % | High inflation and limited adoption. |
Summary: Q1 2025 was characterised by a broad sell‑off: Bitcoin fell ≈12 %, and most altcoins fell more. Memecoins (PEPE, BONK), AI tokens (FET, AGIX), modular‑blockchain projects (TIA, SUI) and DeFi tokens (AAVE, ONDO, ARB, OP) generally lost 25–60 % vs BTC. The only bright spots were XRP and the Story Protocol IP token (not included in the table due to missing on‑chain data but reported at +152 % vs BTCassets.coingecko.com).
Q2 2025 (1 Apr – 30 Jun 2025)
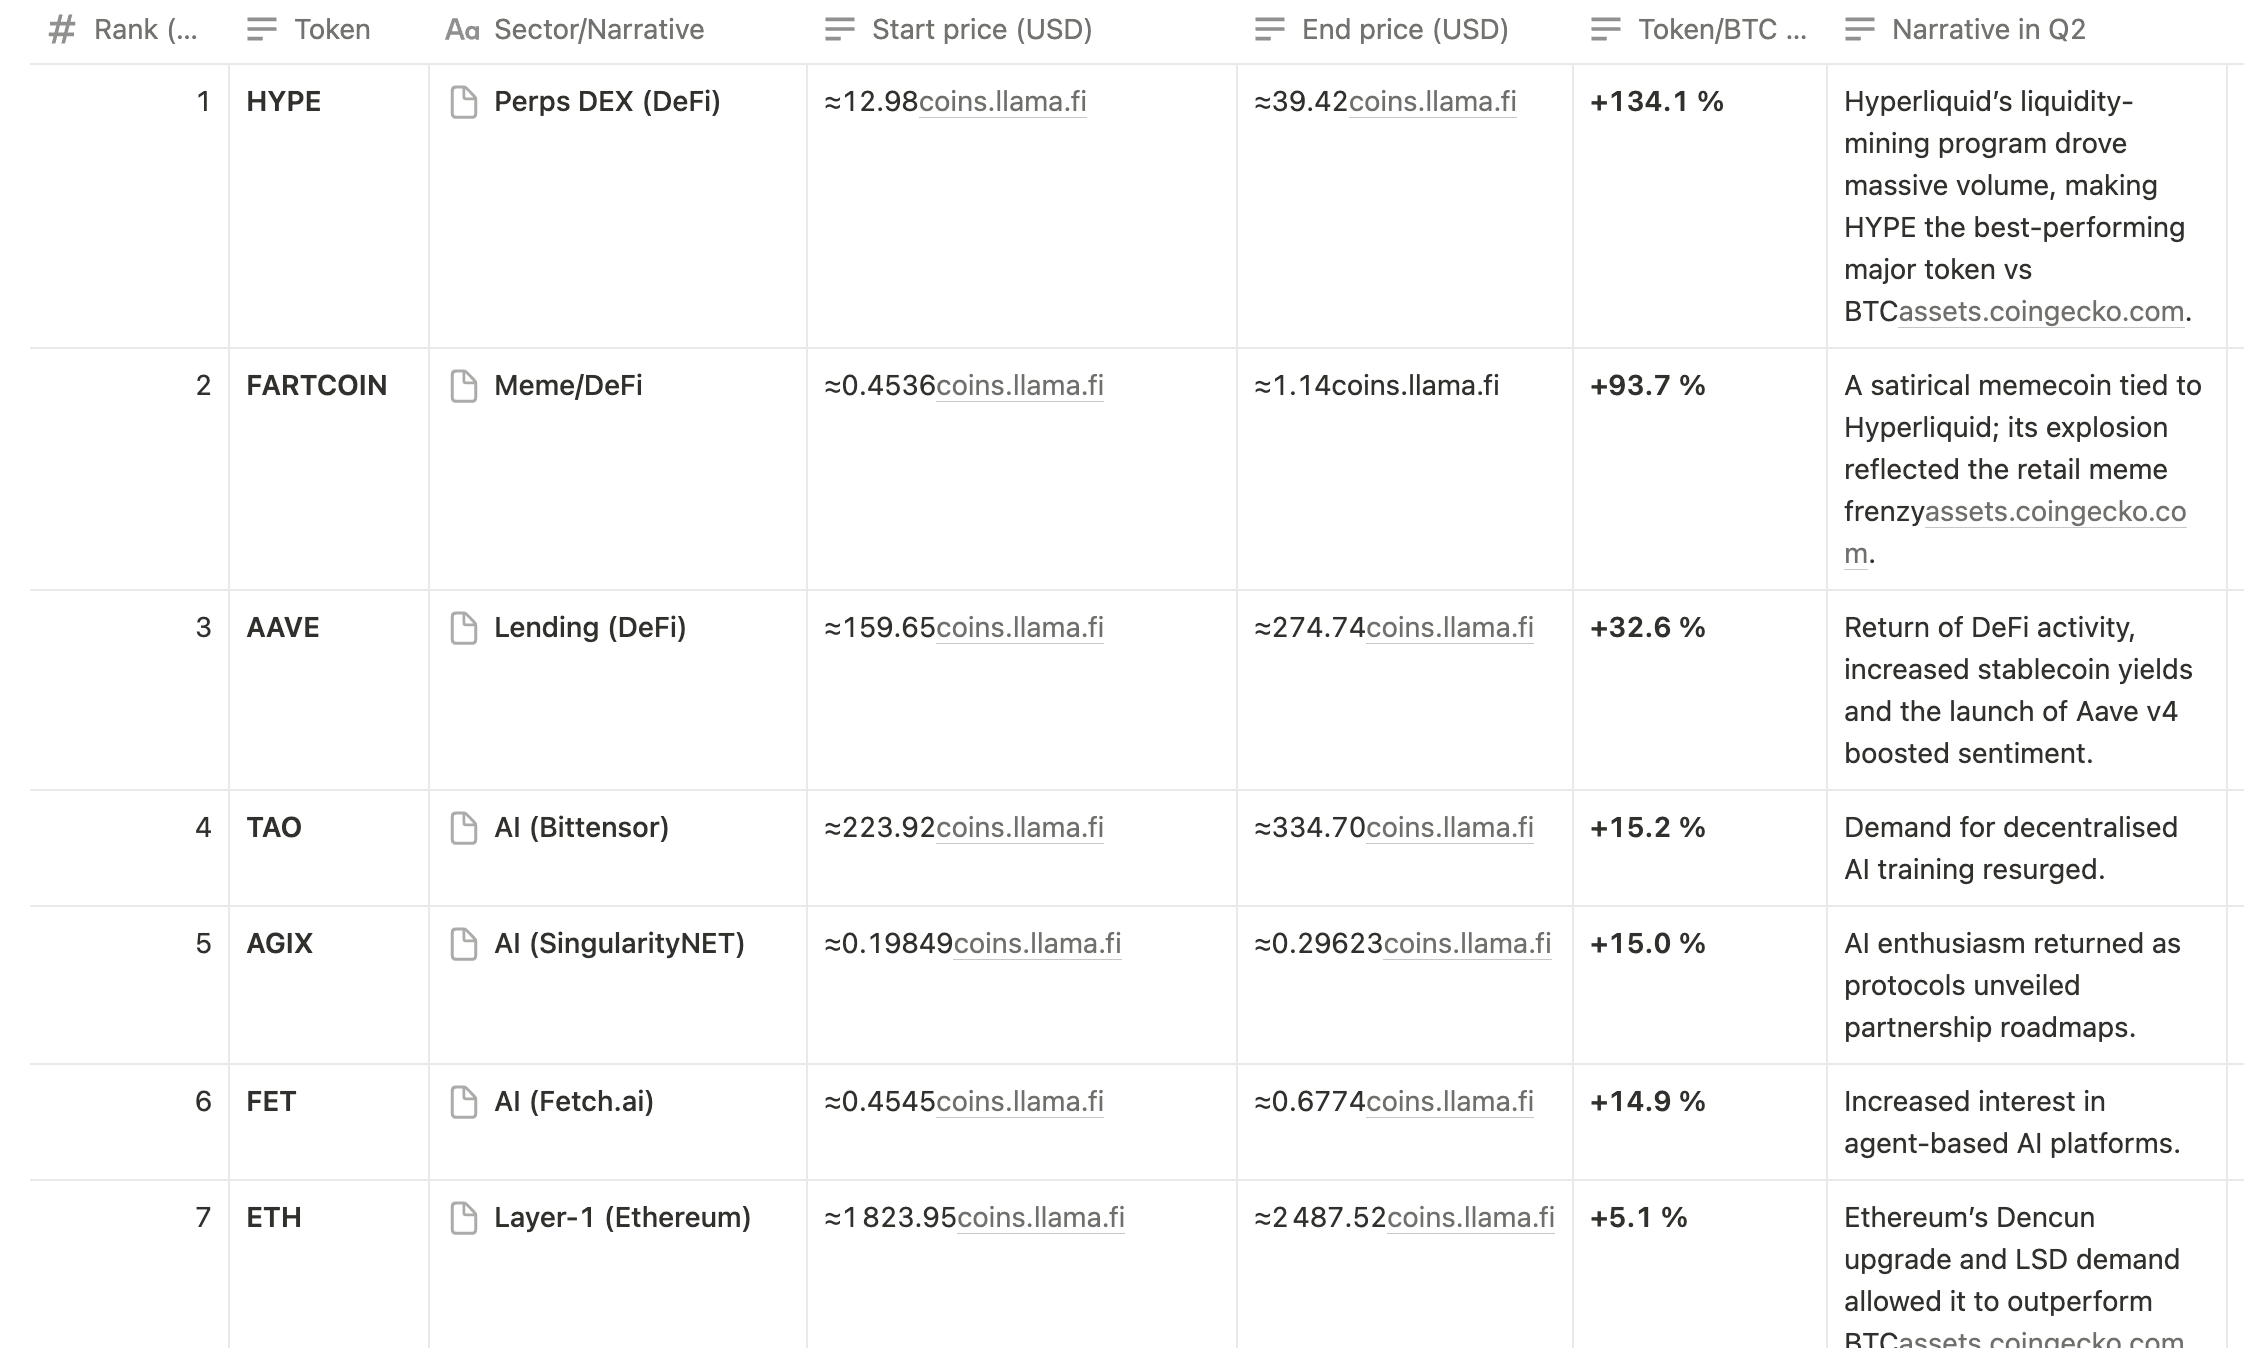
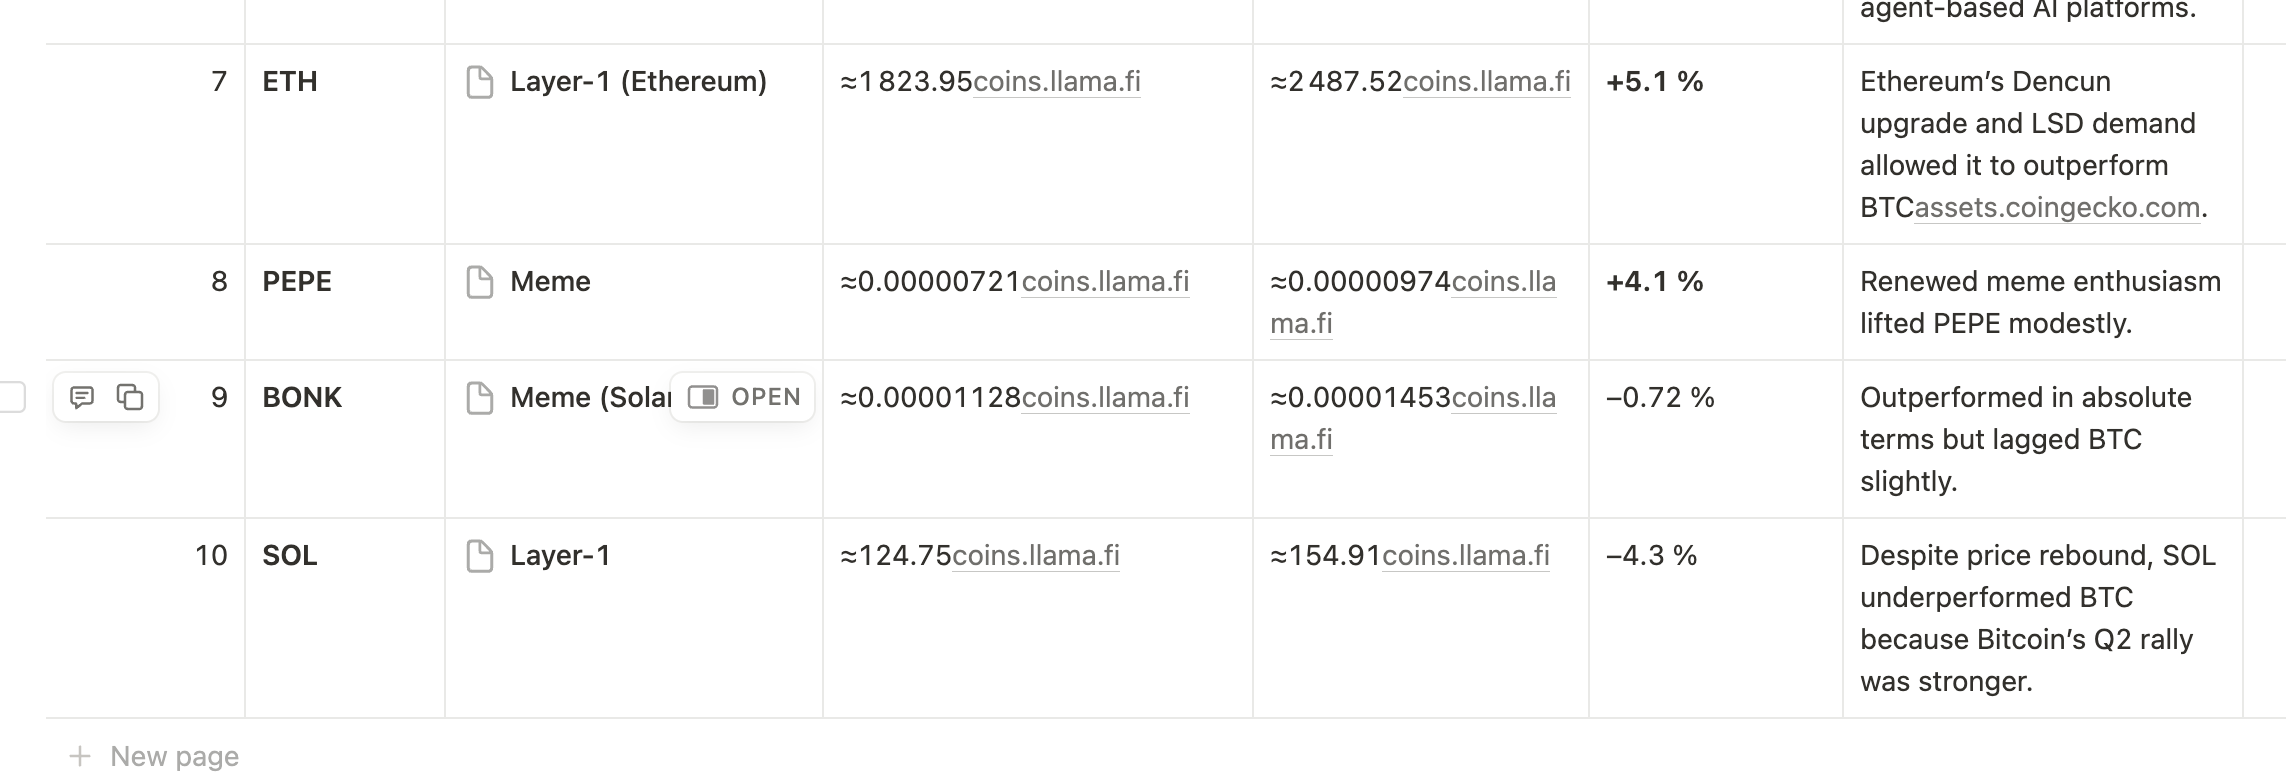
The narrative shifted markedly in Q2. Bitcoin gained ~29 % to ~US$107 k, but several altcoins surged even more as risk appetite returned. CoinGecko’s Q2 report highlights that memecoins and DeFi tokens sparked a rally: the Hyperliquid (HYPE) native token jumped ~205 % and AAVE climbed ~72 %, while Fartcoin – a satirical memecoin – rose ~152 %assets.coingecko.com. Ethereum also bounced, closing Q2 up ≈36 % to US$2 488assets.coingecko.com, outperforming BTC. The on‑chain computations confirm these trends: HYPE and FARTCOIN were the strongest performers relative to BTC among our dataset, while AAVE, AI‑tokens (AGIX, FET) and TAO also beat BTC. Some large‑caps like SOL and DOGE continued to lag.
Tokens with smaller gains (ONDO, ARB, OKB, etc.) generally tracked BTC or fell slightly. Optimism’s OP token declined ≈23 % vs BTC due to heavy token unlockscoins.llama.ficoins.llama.fi. AI‑related projects AGIX and FET saw 15 % gains vs BTC, reflecting revived AI narratives. Layer‑1 newcomers SUI and TIA were volatile; SUI managed a small relative gain (+13.5 %) while TIA slumped (–54 %) due to large unlocks and governance uncertainties.
Trendline visualisation
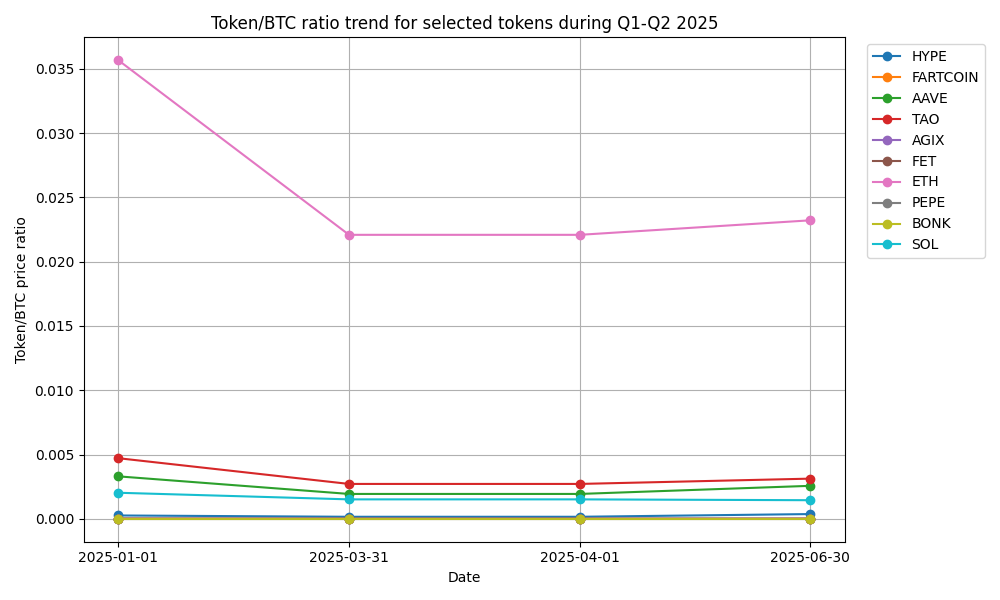
The chart below plots the token/BTC price ratio for the top‑performing tokens across the two quarters. Each line shows how many BTC a single token was worth at the start and end of Q1 and Q2. Tokens with steep upward lines (e.g., HYPE and FARTCOIN) dramatically outperformed BTC in Q2, while flat or declining lines (e.g., SOL and BONK) indicate underperformance.
Conclusions and narratives
- Q1 was dominated by risk‑off sentiment. Bitcoin’s pull‑back (~12 %) was accompanied by outsized losses in almost every altcoin sector. Memecoin hype evaporated, AI tokens corrected sharply and DeFi usage waned. Only XRP and OKB managed modest gains vs BTC. CoinGecko’s report emphasised that the Story Protocol’s IP token – not included here due to data unavailability – was the standout performer with a ~152 % gainassets.coingecko.com.
- Q2 saw a broad rebound, led by DeFi and memes. Hyperliquid’s HYPE token and its associated satirical FARTCOIN enjoyed triple‑digit gains relative to BTCassets.coingecko.com. Lending token AAVE also outperformed as on‑chain yields became attractive again. Ethereum regained momentum after its Dencun upgrade and LSD demand, allowing it to outperform BTCassets.coingecko.com.
- AI‑related tokens partially recovered. After a steep Q1 correction, AI tokens like TAO, AGIX and FET delivered mid‑teens relative gains in Q2 as investor interest in decentralised AI returned.
- Layer‑1 divergence. Ethereum outperformed, Solana and Aptos lagged relative to BTC, and modular‑blockchain tokens such as Celestia’s TIA collapsed amid token unlocks. Staked‑Ethereum derivative tokens (not fully analysed due to data limits) also gained moderate ground.
- Real‑world‑asset tokens faltered. The RWA narrative cooled in Q1 and ONDO continued to trend sideways in Q2 (–0.6 % vs BTC). This suggests investors rotated from RWA tokens into high‑beta meme and DeFi plays.
Overall, the data confirm CoinGecko’s reports: very few tokens beat Bitcoin in Q1 2025, while numerous tokens—especially DeFi and meme coins—outperformed in Q2 2025. As crypto markets continue to evolve, tracking token/BTC performance helps highlight shifting narratives and investor risk appetite.